
Trading with the Wyckoff Method
With the price action of Bitcoin entering a sorely needed cool down phase as of late, the Wyckoff Method has been getting a lot of attention in the Crypto space as many try to evaluate this new trading range and guess where we are heading next:
I personally have been dabbling with the Wyckoff Method for a bit too, as introduced to me by the Fantastic Tijo at the Arcane Bear, and so I thought I’d try covering it here.
Richard D. Wyckoff
The man behind the method, Richard D. Wyckoff was a Technical Analysis pro. Running his own Wall Street firm from a very young age, Wyckoff spent his career studying the markets and their many recurring behavioural patterns and became fascinated by how consistently he would observe new retail investors being manipulated and shaken out of their trades by larger players. Wyckoff began to formulate his concept of the Composite Man, a heuristic device for personifying the trading techniques of the big players, the JP Morgans of the day.
Composite Man
Wyckoff proposed that by studying how Comp Man plays the game, one can begin to learn his tricks and use them against him to dominate the markets. See Comp Man had his tactics, but will regularly fall back on the same tricks:
- Comp Man will be early to a trade, investing heavily when it has minimal volume and attention
- Comp Man will dominate the media and control it’s public narratives fabricating hype cycles attracting retail investors to buy their bags
- Comp Man will meticulously shape market cycles, fine tuning their buying and selling volume to give the appearance of an incredibly healthy, broad and bullish market
- The observed behaviour and the hidden agenda of Comp Man are not always the same. Comp Man might be selling a stock heavily and openly with the secret motive of accumulating more, or they may be publicly buying up positions with the intention of getting out at a higher price as soon as possible. By focusing on the Macro goals of Comp Man, you can learn to see through the facade of their short term manipulation
Price Cycles
Wyckoff believed that every market can be represented by a continuous battle between Supply and Demand, creating ranges for Accumulation and for Distribution on both a Macro and Micro scale. Wyckoffs Price Cycles can be represented by an idealised S curve as shown below:
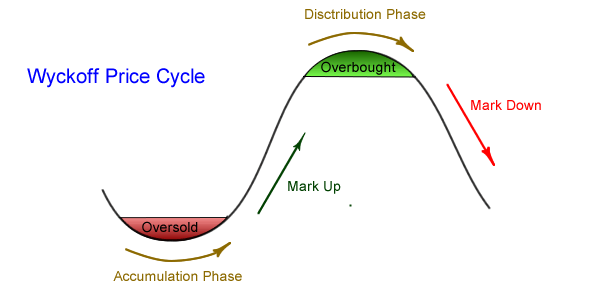
By learning to identify these Accumulation and Distribution phases correctly, one can make the correct plays and learn to dominate markets alongside Comp Man!
Trading Ranges
A Trading Range is a period of market activity where there is relative equilibrium between Supply and Demand, where price action may be contained to a range:
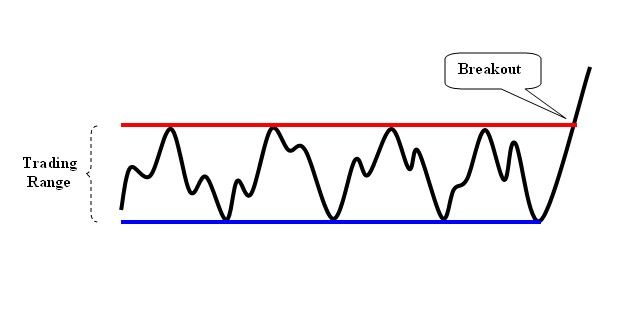
When there is a clear and confirmed line of Support and a level of Resistance, one can consider this an established Trading Range. These ranges provide clarity and confidence for moves on the shorter term, where one might employ leverage in opening short positions near the top or a range and long positions near the bottom of the range. The Support and Resistance provide good levels for setting Take Profit (TP) and Stop Loss (SL) Limit Orders.
Identifying these ranges early allows one to make moves with reduced risk, removed from the larger Macro trend, and is the first step towards understanding whether they are good areas for Accumulation or Distribution.
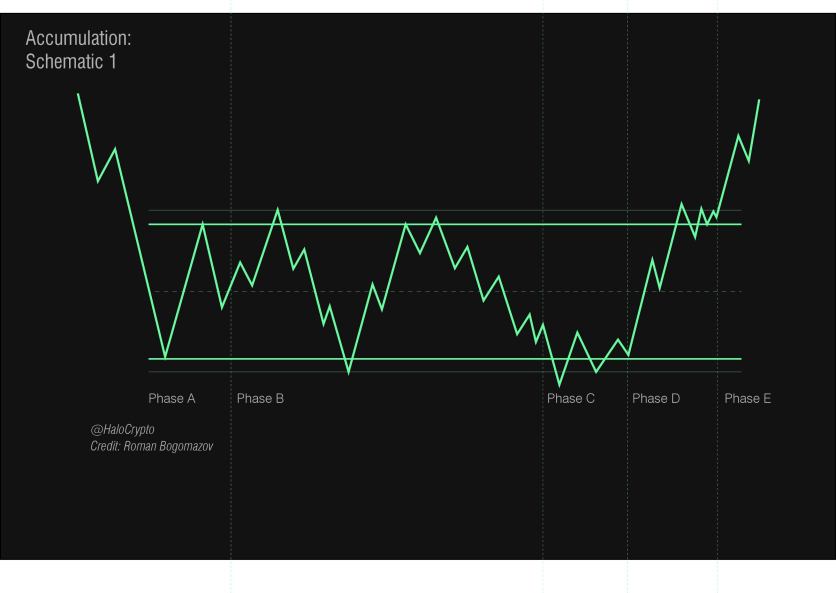
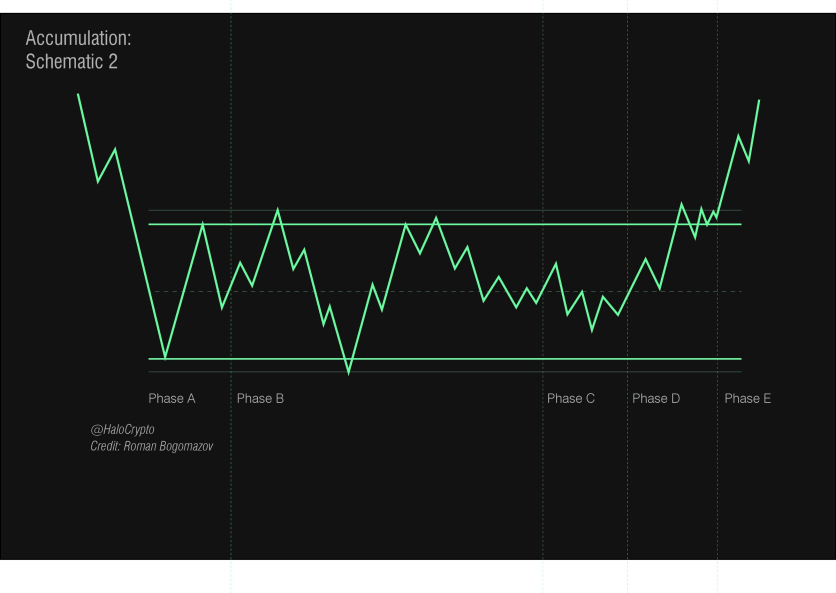
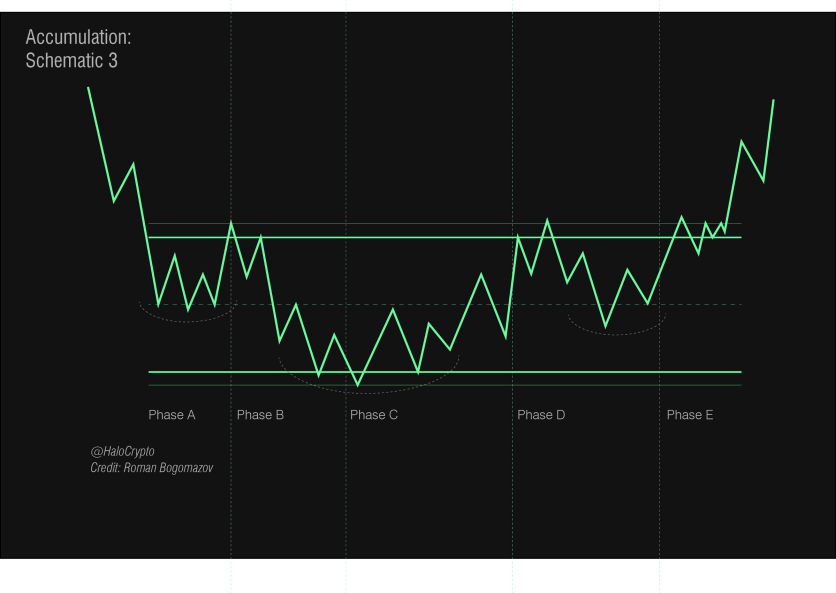
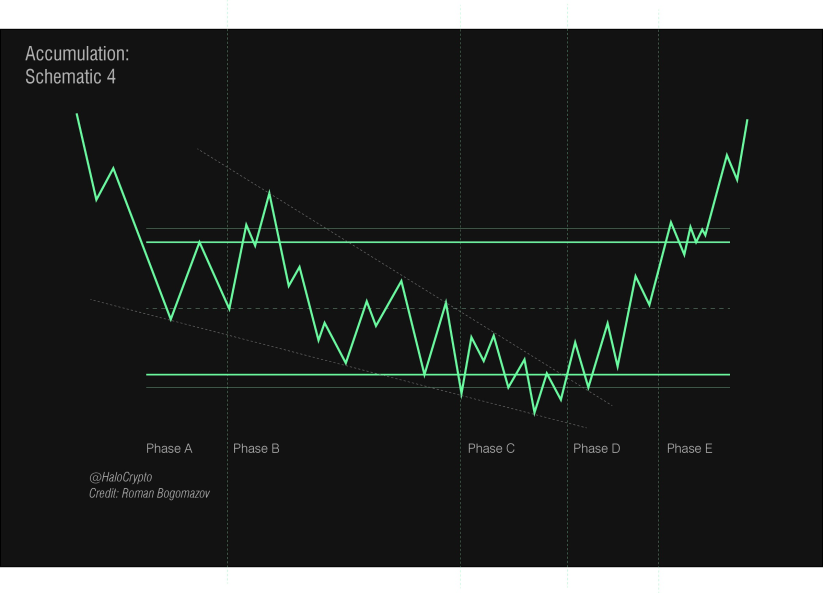
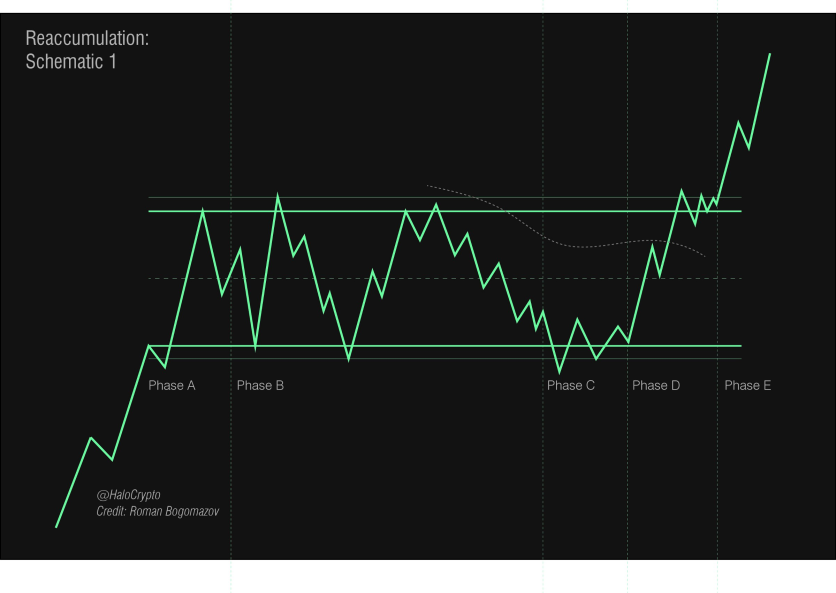
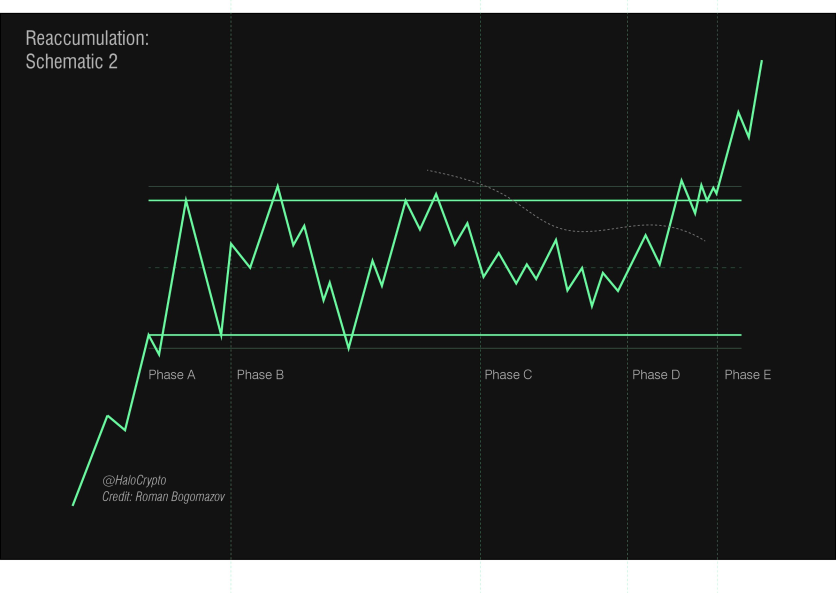
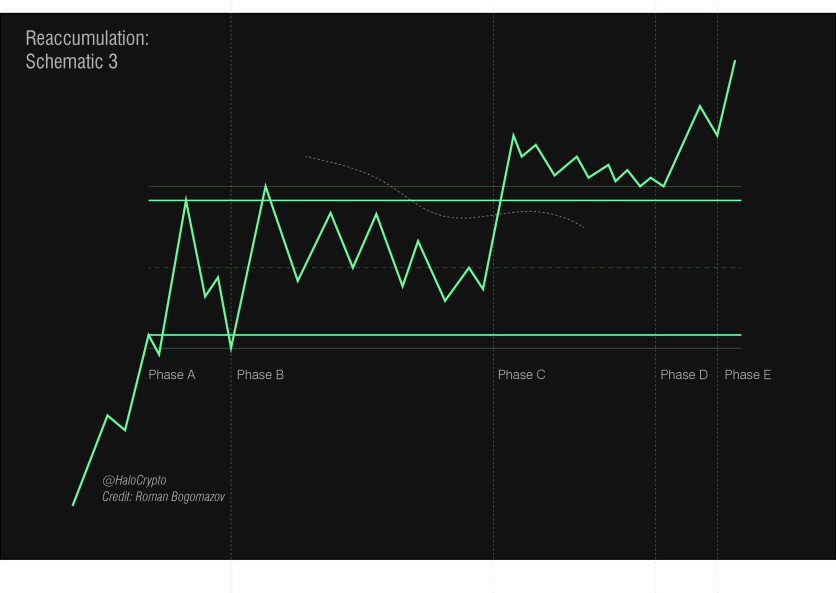
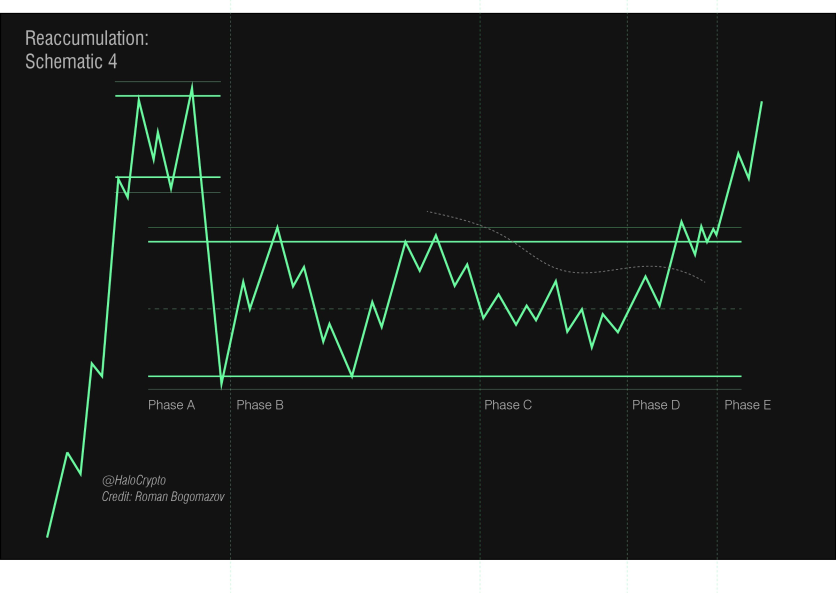
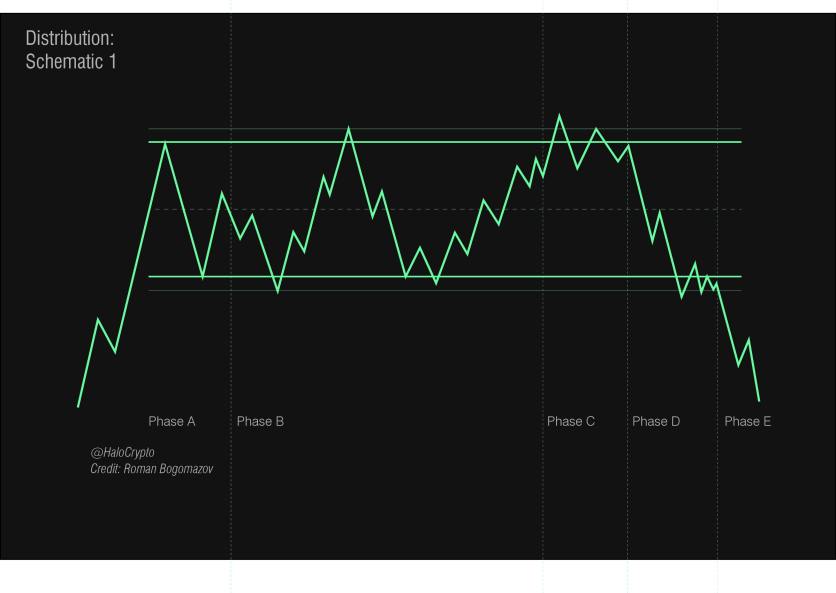
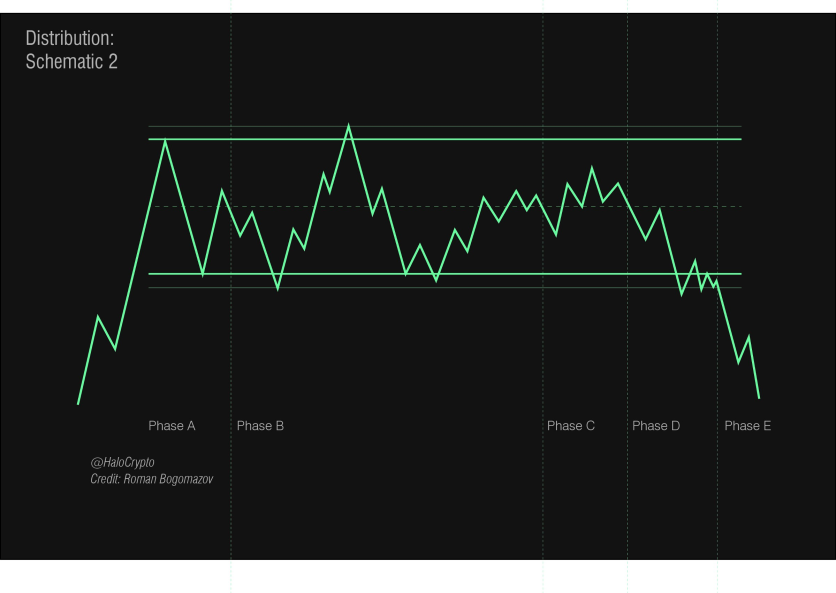
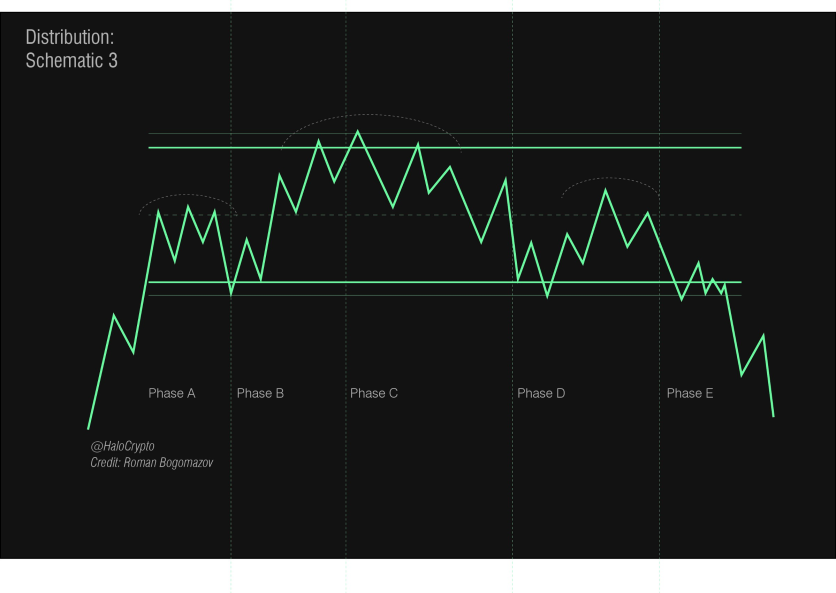
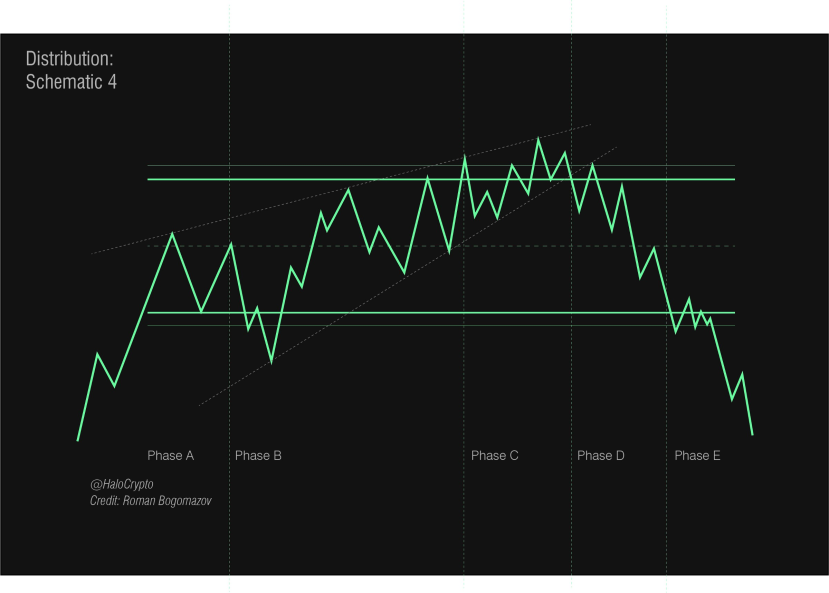
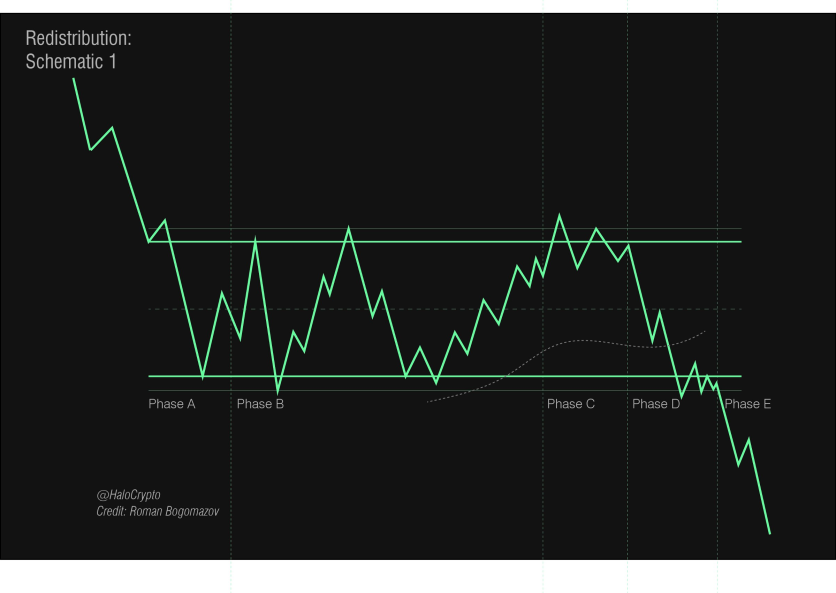
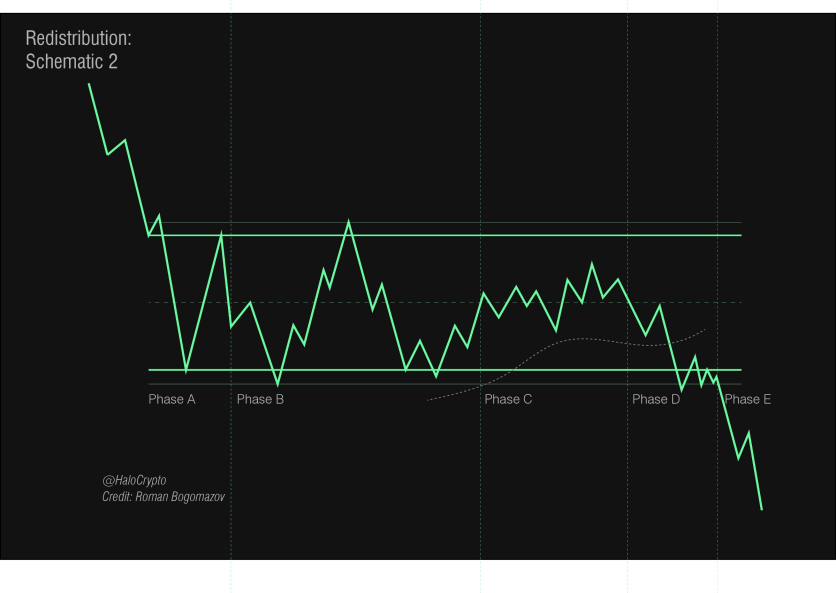
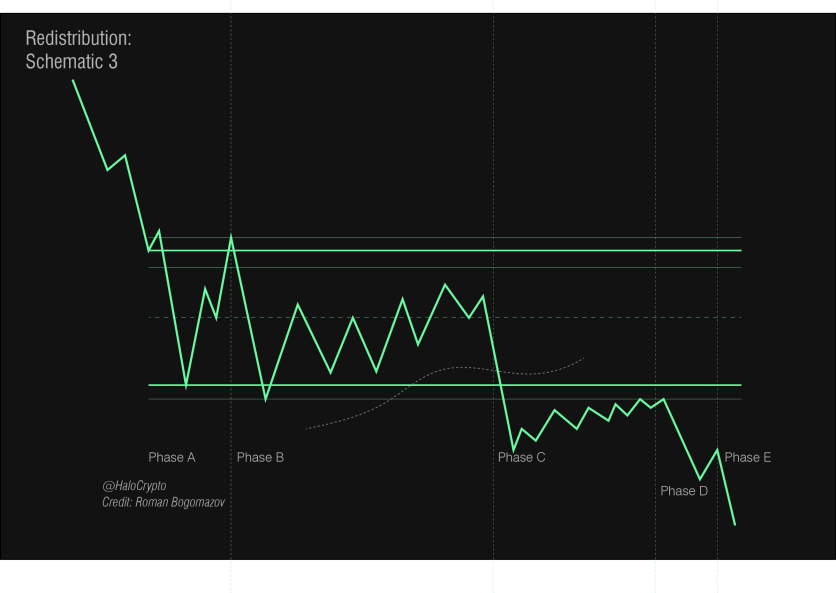
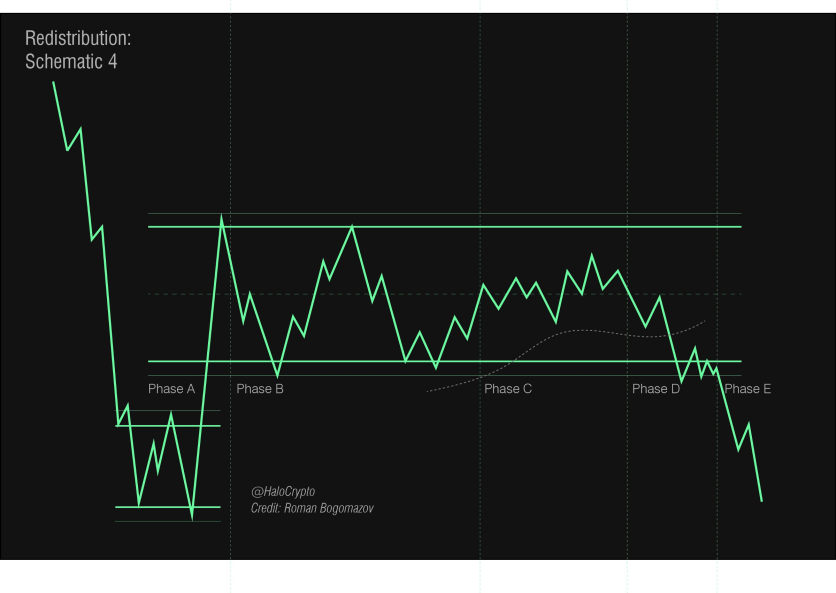
Wyckoff Schematics
The Wyckoff Method teaches that every established Trading Range can be narrowed down into one of four categories, which a handful of common schematics for each (Images courtesy of HaloTrader):
1) Accumulation
The Market has had a Distributionary event and there is a Trading Range established that is providing temporarily discounted prices
2) Re-Accumulation
The Market is in an overall Bullish trend, but is looking overheating. One might want to take some profits off the table and buy back in near the bottom of the range
3) Distribution
The Market is showing weakness, indicating a potential local top
4) Re-Distribution
The Market is in an overall Bear trend, but selling pressure is taking a break before we go for lower lows
Accumulation Phases and Events
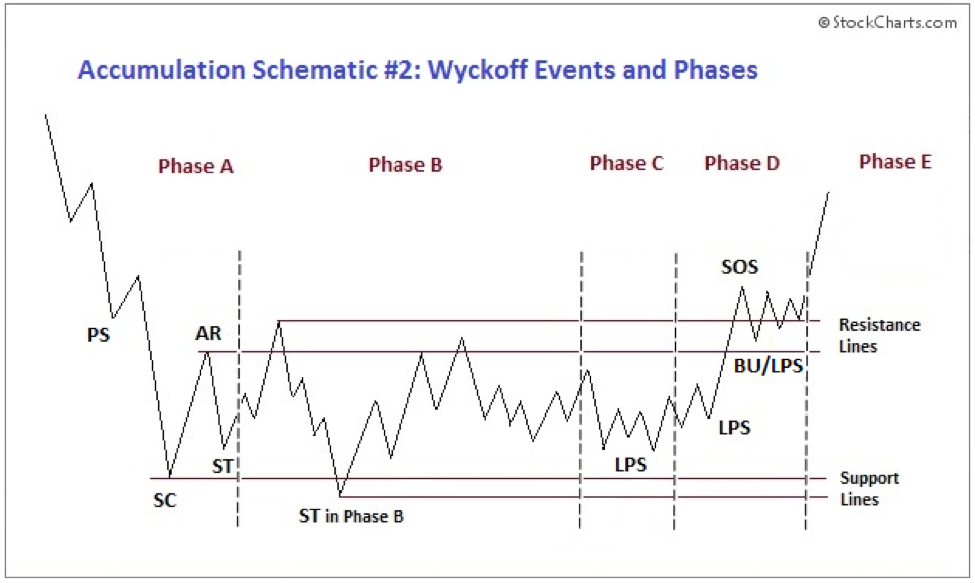
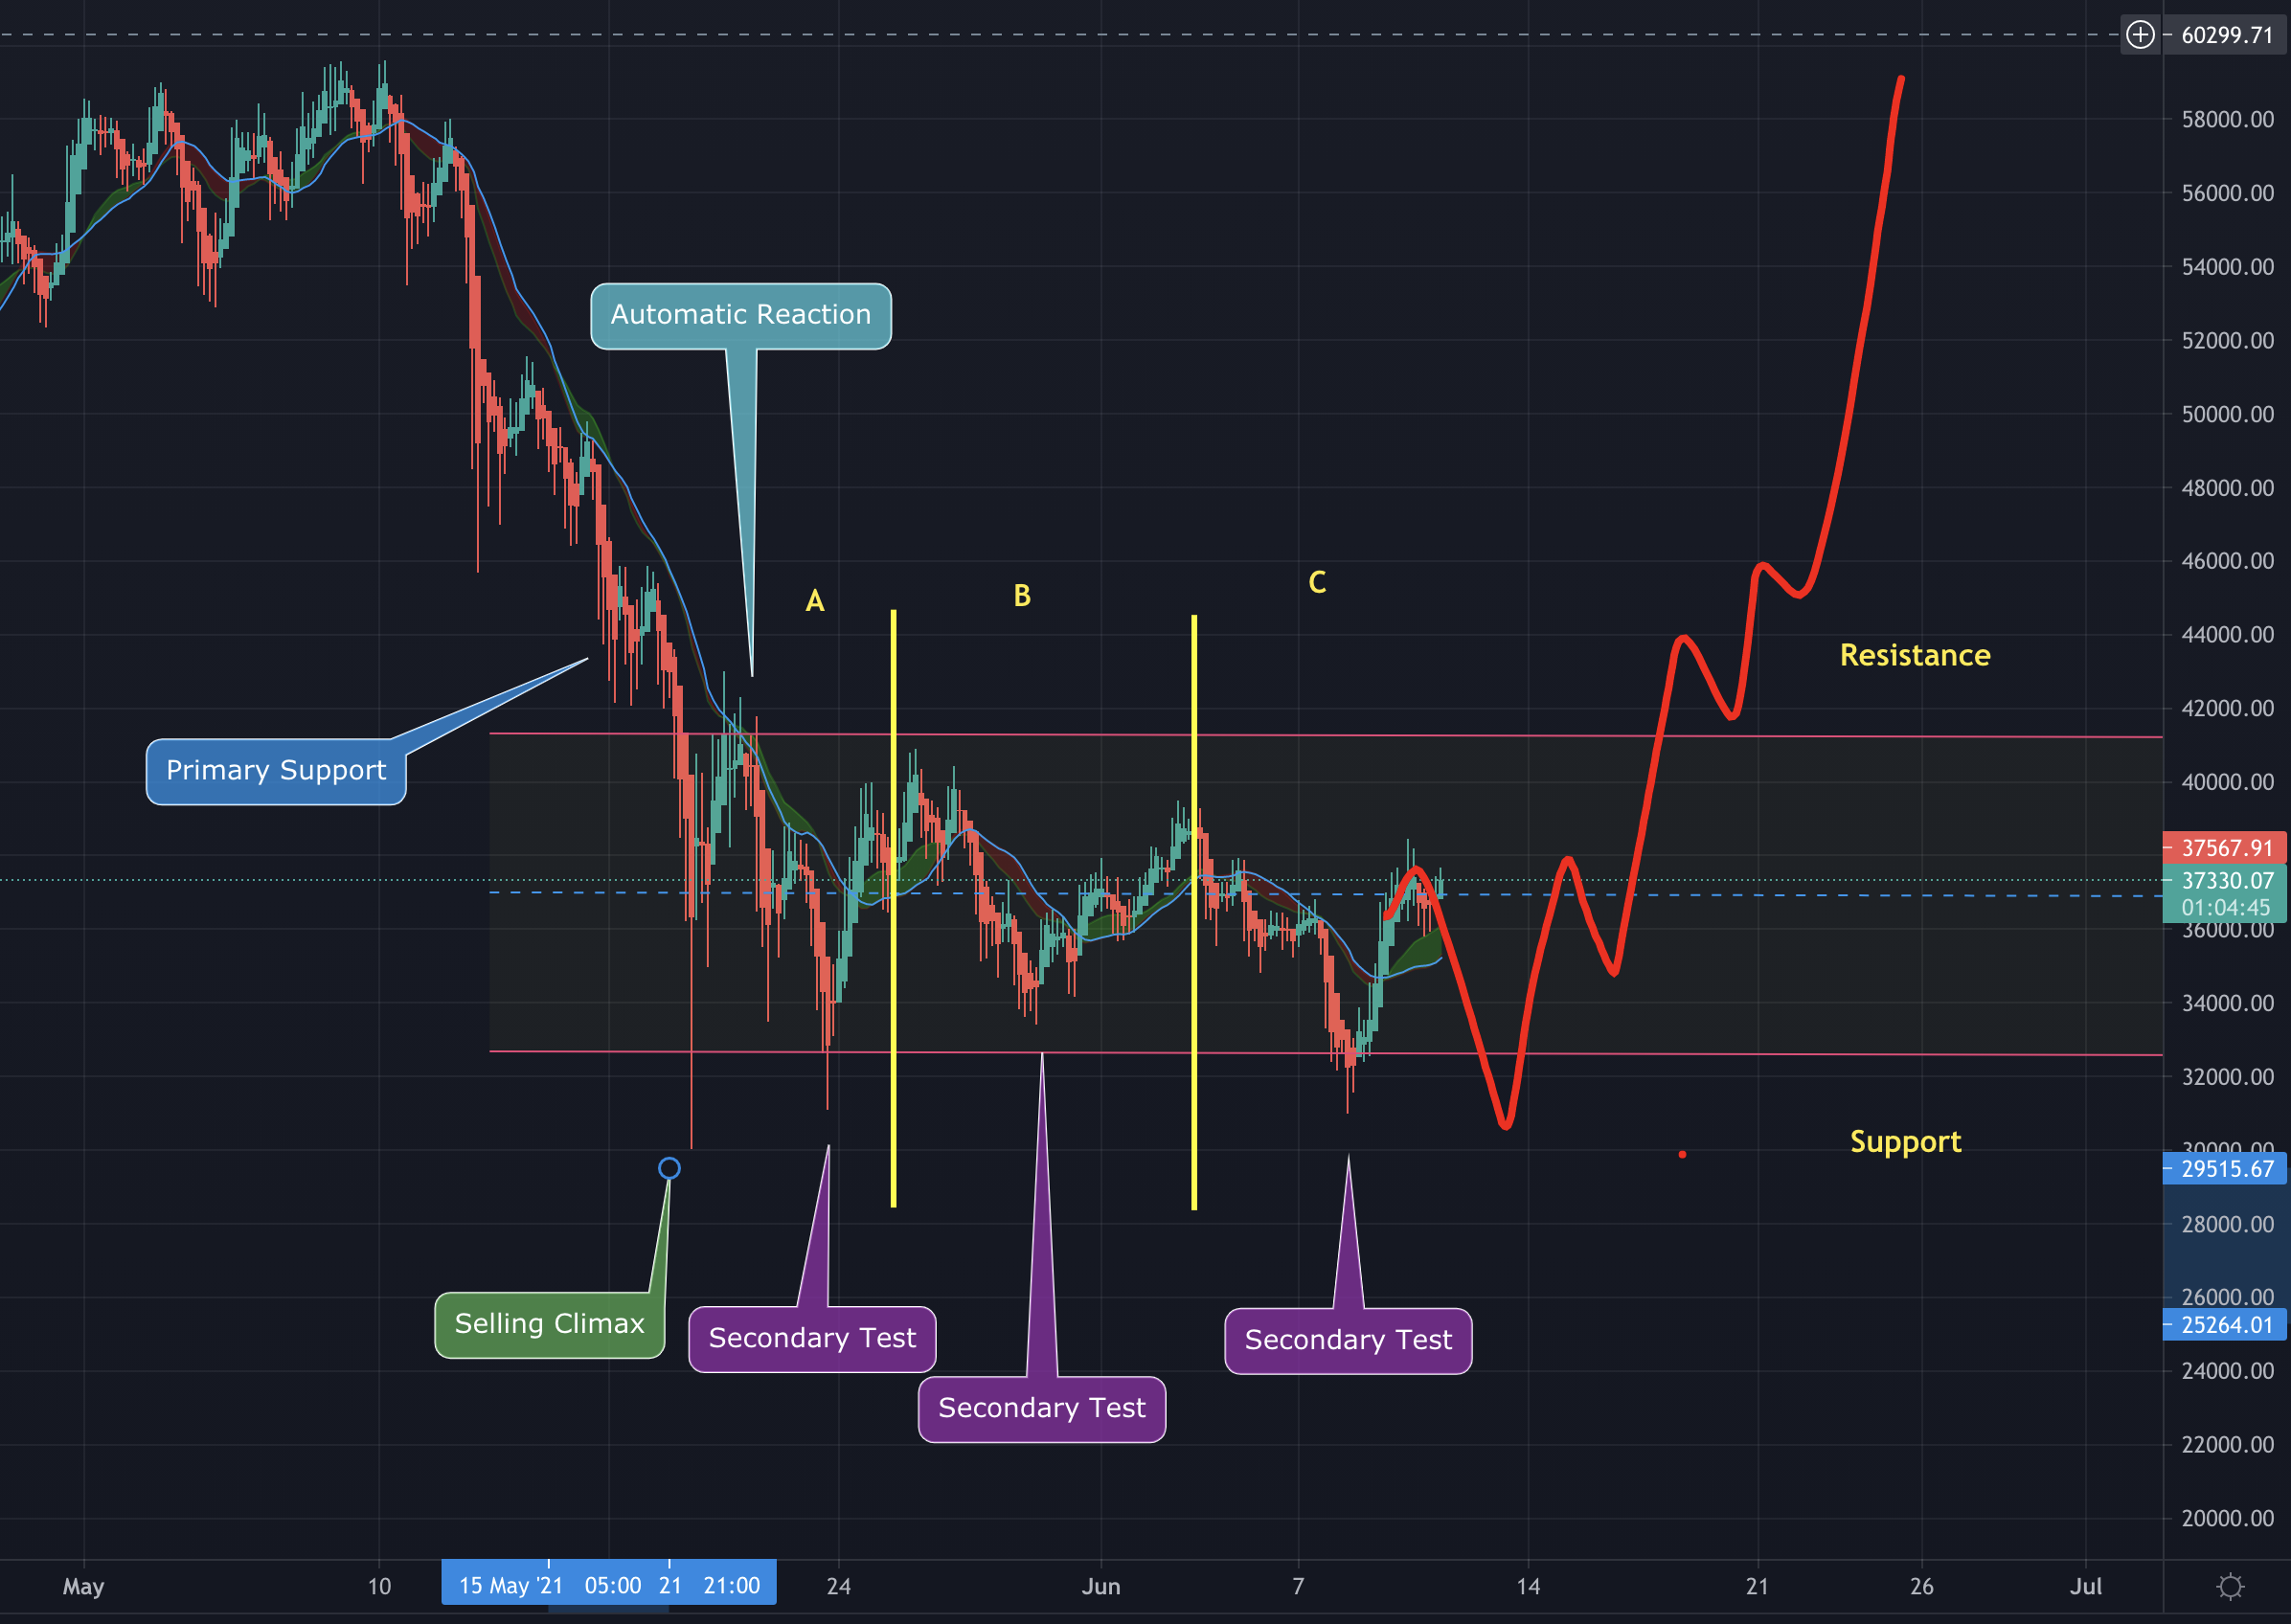
Phase A. Stopping the previous bearish trend .
• PS. Preliminary Support. It’s the first attempt to stop the downward movement that will always fail.
• SC . Selling Climax. Climate action that stops the downward movement.
• AR. Automatic Rally. Bullish reaction. An upward movement that sets the maximum range.
• ST. Secondary Test. Test of the level of supply in relation to climate action. Establishes the end of Phase A and the beginning of Phase B.
Phase B. Construction of the cause.
• UA . Upthrust Action. Temporary breakout of the resistance and re-entry into the range. This is a test at the maximum generated by the AR.
• ST as SOW. Secondary Test as Sign Of Weakness Sample of weakness in test function. Temporary break of the support and re-entry to the
range. This is a test at the minimum generated by the SC .
Phase C. Test
• SP Spring. It is a test in the form of breakout of the minimums of Phases A and B. There are three different types of Springs.
• Test Spring. Downward movement towards lows of the range in order to check the commitment of the sellers.
• LPS . Last Point of Support. Test in the form of a bearish movement that fails to reach the minimum range.
• TSO . Terminal Shakeout or Shakeout. Abrupt movement of minimum breakout that produce a deep penetration of the level of support and a
fast
Phase D. Bullish trend within the range.
• SOS. Sign of Strength. Bullish movement generated after the Phase C Test event that manages to reach the top of the range. Also called JAC.
Jump Across the Creek. Creek jump.
• LPS . Last Point of Support. These are the rising troughs we find in the upward movement towards resistance.
• BU. Back Up. This is the last big reaction before the bull market starts. Also called BUEC. Back Up to the Edge of the Creek. Back to the creek
Phase E. Bullish trend out of range.
•Succession of SOS and LPS generating a dynamic of rising highs and lows.
Distribution Phases and Events
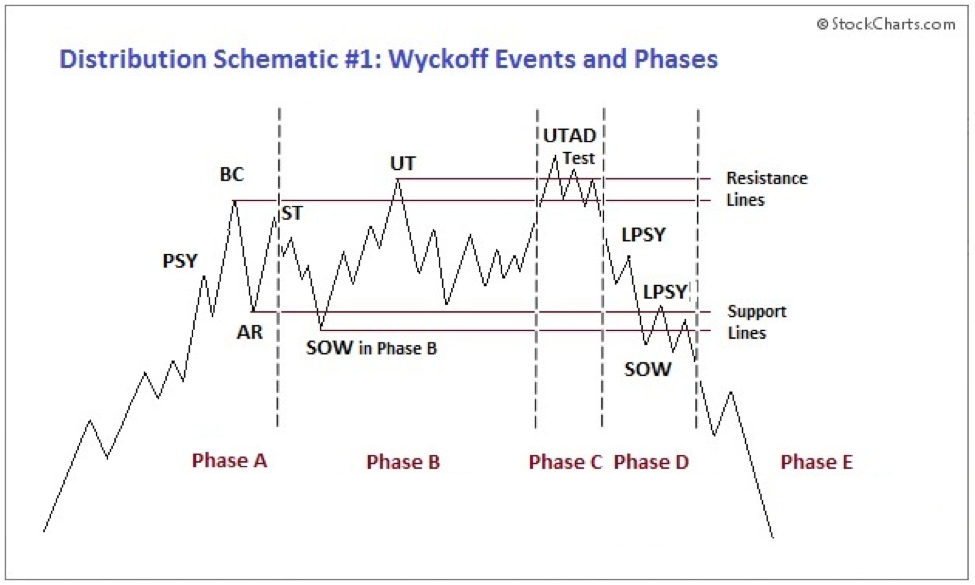
Phase A: Stopping of the prior uptrend.
First significant evidence of supply entering the market is provided by preliminary supply (PSY) and the buying climax (BC). These events are usually followed by an automatic reaction (AR) and a secondary test (ST) of the BC, often upon diminished volume.
Phase B: Build a cause in preparation for a new downtrend.
Phase C: In distribution, Phase C may reveal itself via an upthrust (UT) or UTAD. It is also a bull trap—it appears to signal the resumption of the uptrend but in reality is intended to “wrong-foot” uninformed break-out traders. A UT or UTAD allows large interests to mislead the public about the future trend direction.
Phase D: Clear break of support or with a decline below the mid-point of the TR after a UT or UTAD.
Phase E: Unfolding of the downtrend; Supply is in control.
Resources For Further Study
The Wyckoff Method is a highly involved and complex area of Technical Analysis. Wyckoff Trading not only encompasses the academic study of Trading Ranges (schematics) and analysis of market behaviours (Comp Man), but is in itself a discipline and a mindset to adopt that will help you grow as an investor and as a trader.
Here are some great resources that will help you on your journey!
https://school.stockcharts.com/doku.php?id=market_analysis:the_wyckoff_method
https://halotrader.medium.com/wyckoff-schematics-c5cb7f0ac221